
Geo-Grid Rank Tracking: Powerful Visibility Data When Used Correctly
Geo-grids aren’t broken—and they’re not magic. Learn how to use geo-grid rank tracking alongside GBP performance, analytics, and seasonality for real Local SEO insights.


What Geo-Grids Are and How They’re Used in Local SEO
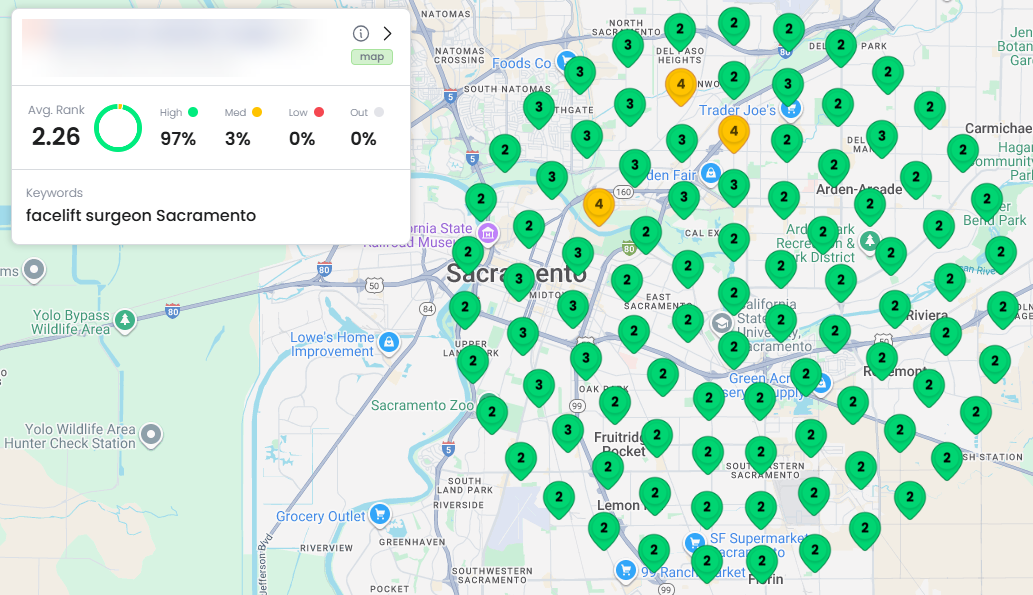
Geo-grids are a local visibility measurement tool designed to answer a simple but important question: where does a business actually appear in Google’s local results across a real geographic area? Instead of assuming a single “rank,” geo-grids simulate searches from many physical locations—each one representing a different street, neighborhood, or radius within a market.
At a technical level, a geo-grid test works by selecting a keyword, defining a service area, and running searches from multiple latitude and longitude points. Each point, often called a node, records whether the business appears in the local map pack and at what position. When these results are visualized together, they form a grid that shows strength, weakness, and coverage across the market.
Geo-grids are commonly used to:
Measure local visibility beyond a single search location
Identify pockets of strong and weak performance within a service area
Track progress over time as optimizations are applied
Compare performance across keywords, categories, or locations
Metrics like Average Rank Position (ARP) and Share of Local Voice (SoLV) come from aggregating these node-level results. ARP helps show overall trend direction, while SoLV reflects how much of the market consistently sees the business in top positions. Neither metric claims to be absolute. They are directional indicators meant to guide decisions, not replace outcomes.
When used correctly, geo-grids help marketers stop guessing based on personal searches and start thinking spatially. They shift the conversation from “where do we rank?” to “where are we visible, and where are we not?” That distinction is what makes geo-grids valuable—when they’re treated as a visibility model, not a promise of revenue.
Where to Get Geo-Grid Rank Tracking Data
Geo-grid rank tracking isn’t something Google provides directly. To generate these reports, you need third-party tools that simulate searches from multiple geographic points and compile the visibility data into a grid format.
There are several solid options available, and while the interfaces and reporting styles vary slightly, they all serve the same core purpose: helping you understand how visible a business is across a real geographic area, not just from one fixed location.
Three commonly used geo-grid tools in local SEO are Local Dominator, Local Falcon, and Local Viking.


Local Dominator focuses heavily on actionable visibility insights and integrates well into ongoing local SEO workflows. Local Falcon is widely known for its visual grid reports and share-of-voice style metrics. Local Viking combines geo-grid tracking with broader local SEO features, including scheduling and GBP management.
It’s important to understand that no matter which tool you use, the data should be interpreted the same way. Geo-grids are visibility models, not exact rankings. The real value comes from tracking trends over time, identifying weak areas in a service region, and measuring how your optimization efforts expand visibility outward—not from obsessing over a single scan or a perfectly green grid.
Why Geo-Grids Exist in the First Place
Geo-grid tools didn’t come out of nowhere, and they weren’t created to make reports look flashy. They exist because local search is fundamentally different from traditional organic search—and for a long time, marketers had no reliable way to observe that difference at scale.
In local search, there is no single, universal ranking. What a person sees in the map pack depends on where they are physically located, what device they’re using, whether they’re logged into a Google account, their past behavior, and even subtle contextual signals like time of day. Checking rankings by searching your business name or service keyword from your own phone doesn’t measure performance—it measures your version of Google.
Geo-grids were created to solve that problem by answering a better question:
How visible is this business across its actual market?
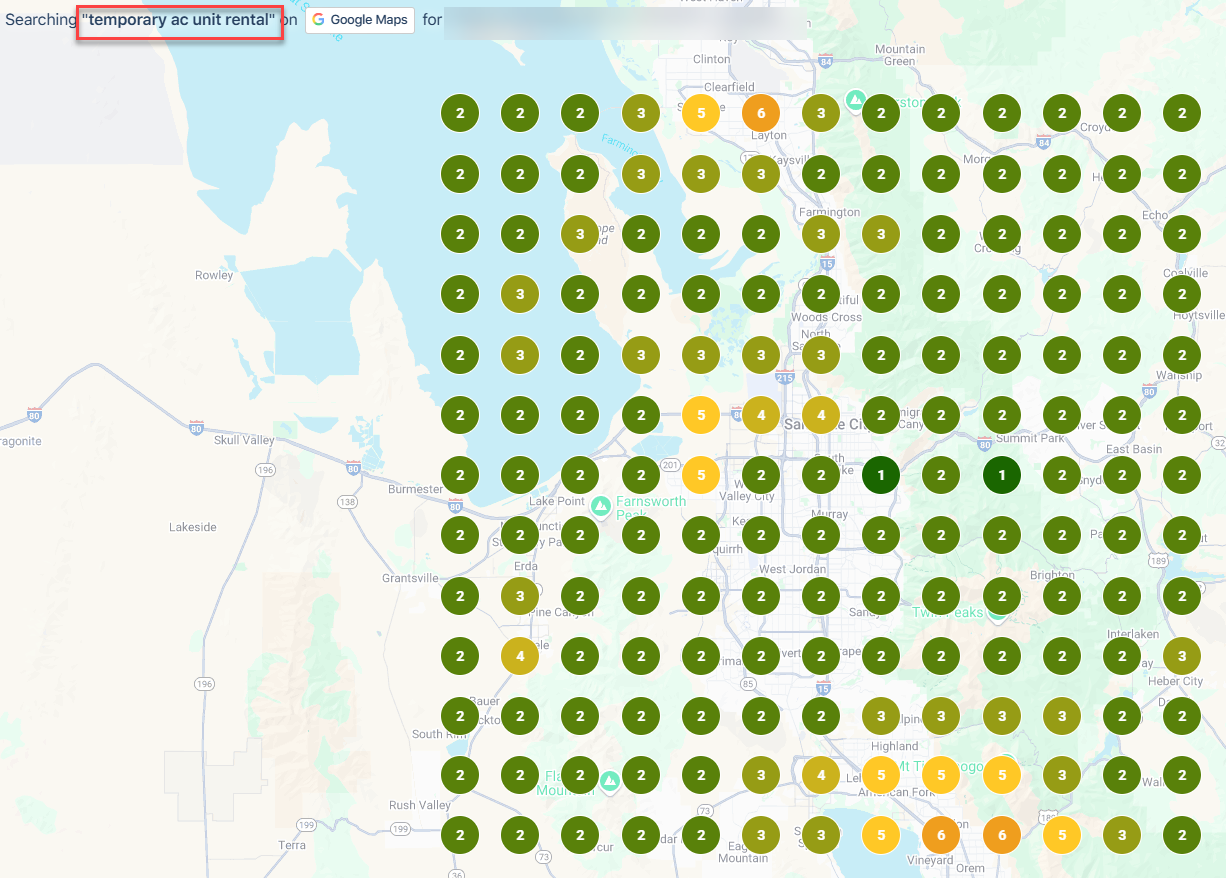
Instead of relying on a single search from a single location, geo-grids simulate searches from many different points across a service area. Each point represents a potential customer standing somewhere in the real world. The goal isn’t to declare a single “rank,” but to understand coverage, consistency, and reach.
At their core, geo-grids are designed to help with things like:
Visualizing where a business is strong versus weak within its service area
Identifying geographic edges where rankings drop off
Tracking whether visibility is expanding or contracting over time
Comparing performance across neighborhoods, cities, or regions
This matters because local SEO success is rarely evenly distributed. A business might dominate downtown but disappear five miles away. Without a spatial view of visibility,
those gaps are easy to miss—and impossible to fix intentionally.
It’s also important to be clear about what geo-grids were never meant to be. They are not a replacement for analytics. They don’t measure demand, conversions, or revenue. They don’t claim to show “the one true ranking.” They are a model—a structured way to sample and observe a system that is inherently dynamic and personalized.
When used as a guiding tool instead of a definitive scorecard, geo-grids provide something incredibly valuable: context. They help marketers understand where visibility exists, where it doesn’t, and how that picture changes as optimization work is done. Everything else—calls, clicks, form submissions, and sales—needs to be layered on top of that view.
That distinction is where most misunderstandings about geo-grids begin, and it’s also where their real value becomes clear.
The Wrong Question Isn’t “Are Geo-Grids Accurate?”
One of the most common debates around geo-grids starts with the wrong premise. People ask whether geo-grids are “accurate,” usually expecting a yes-or-no answer. That framing misses how both Google and geo-grid tools actually work.
Google does not return a single, fixed set of results for a local search query. Two people standing in the same place, searching the same keyword, can see different businesses in the map pack. Change the device, the browser, login state, or recent search history, and the result set can shift again. Variability is not a bug in local search—it’s a defining characteristic of it.
Because of that, expecting geo-grids to return perfectly identical results every time misunderstands their purpose. A geo-grid isn’t attempting to replicate one exact user experience. It’s sampling many possible ones.
In other words, consistency and accuracy are not the same thing.
A geo-grid can produce slightly different results across repeated runs and still be accurate within the reality of how Google operates. What matters is not whether every node matches perfectly every time, but whether the tool reliably captures directional visibility patterns:
Where the business commonly appears in the top results
Where it struggles or drops out entirely
How those patterns change after optimizations
How coverage compares across different keywords or locations
If a business gains visibility across more of the grid over time, that signal is meaningful—even if individual nodes fluctuate. The same principle applies in analytics: session counts vary day to day, but trends still tell the story.
Problems arise when geo-grids are treated as static truth instead of probabilistic data. When someone assumes that a single grid run represents an absolute, repeatable ranking, any variation feels like failure. In reality, that variation often mirrors the same volatility users experience in the real world.
Geo-grids are best understood as a guiding instrument, not a verdict. They help answer questions like:
Is our visibility expanding or contracting?
Are optimizations improving coverage where it matters?
Are we gaining ground in high-intent areas or just isolated pockets?
When interpreted this way, geo-grids don’t lose value because they aren’t perfectly consistent. They gain value because they reflect the fluid, contextual nature of local search itself.
How Geo-Grids Are Built (And Why That Matters)
Not all geo-grids are created the same way, and understanding how they’re built goes a long way toward understanding why results can differ between tools—or even between repeated runs of the same tool. The construction method directly affects what data you’re actually looking at.
Broadly speaking, geo-grid tools are built using one of two approaches.
The first approach relies on Google APIs. This method pulls location-based results directly from Google’s data endpoints. On paper, this sounds clean and authoritative. In practice, it comes with major limitations. Google’s APIs do not fully replicate real-world local search behavior, and in some cases they exclude entire classes of businesses—most notably Service Area Businesses. The result is a dataset that can look precise but doesn’t always reflect what actual users see in the map pack.
The second approach uses simulated searches through headless browser sessions. These tools attempt to behave more like a real user by loading Google results through controlled environments that mimic location, device type, and query behavior. This method generally produces a closer approximation of real-world visibility, but it also introduces variables that need to be understood rather than ignored.
Some of the most common factors that influence geo-grid results in headless or scraping-based systems include:
Whether the session is treated as mobile or desktop
Whether the IP address appears residential, corporate, or data-center based
Whether the IP is known to Google as a VPN or proxy
How Google interprets the location context beyond raw latitude and longitude
Differences between Google Maps searches and Google Search results that include a map pack
It’s also important to note that Google Maps and Google Search do not use identical algorithms. A search performed directly inside Google Maps is not the same as a search performed on Google.com that triggers a local map pack. The overlap is substantial, but the weighting is different. That means two tools can both be “right” while still showing slightly different pictures of visibility.
None of this means geo-grids are unreliable. It means they are models, not mirrors. Every geo-grid is making assumptions about how to simulate a local searcher, and those assumptions affect the output. The mistake isn’t using a tool that has variability—it’s assuming that variability invalidates the insight entirely.
When you understand how a geo-grid tool gathers its data, you’re better equipped to interpret what it’s telling you. The value comes from patterns, movement, and comparisons over time—not from expecting a perfectly repeatable snapshot in a system that was never static to begin with.
Why Geo-Grid Results Can (and Will) Vary
Once you understand how geo-grids are built, result variability stops being surprising and starts being expected. Local search is influenced by far more than just a keyword and a latitude/longitude point, and geo-grids are sampling a system that is constantly adapting in real time.
One of the biggest contributors to variation is how Google interprets context. A geo-grid node may represent a physical location, but Google doesn’t rely on location alone when deciding which businesses to show. It layers in additional signals that geo-grid tools can only approximate.
Some of the most common reasons geo-grid results fluctuate include:
Device assumptions: Mobile and desktop results are weighted differently, especially for proximity and immediacy
Session trust: Google evaluates whether a request looks like a real human, an automated process, or something in between
IP reputation: Datacenter IPs, known proxy networks, and VPN ranges can be treated differently than residential traffic
Search surface differences: Google Maps searches and Google Search map packs do not behave identically
Personalization bleed-over: Even “clean” sessions can inherit inferred preferences or suppression rules
There’s also a timing element that’s easy to overlook. Google continuously tests and rotates businesses in local results to evaluate engagement and satisfaction. Two searches run minutes apart can surface different businesses as Google refines its confidence in what should be shown.
This variability is not noise—it’s signal. It reflects how Google distributes visibility across a market rather than locking businesses into fixed positions. Geo-grids capture snapshots of that distribution. When interpreted over time, they reveal patterns that a single static check never could.
Expecting geo-grids to produce identical outputs across repeated runs assumes Google itself behaves deterministically. It doesn’t. The goal of geo-grid reporting is not to eliminate variance, but to observe how visibility behaves within it.
When you stop treating variability as failure and start treating it as context, geo-grids become far more useful—and far harder to misinterpret.
What Geo-Grids Are Actually Good At
When geo-grids are used for what they’re designed to do, they’re one of the most effective visibility diagnostics available in Local SEO. Their strength isn’t precision at a single point in time—it’s pattern recognition across space and time.
Geo-grids excel at showing relative visibility, not absolute rankings. They make it easy to see where a business consistently appears, where it occasionally shows up, and where it’s largely absent. That kind of spatial awareness is difficult—if not impossible—to get from traditional rank tracking or manual searches.
Some of the most valuable things geo-grids help uncover include:
Geographic strongholds where visibility is stable and defensible
Edge areas where rankings drop just outside the top results
Clusters of opportunity where small improvements can produce outsized gains
Whether visibility is expanding outward or collapsing inward over time
They’re also particularly useful for tracking progress after changes are made. When categories are adjusted, services refined, content added, or authority signals improved, geo-grids provide a visual way to confirm whether those efforts are translating into broader coverage. Even if individual nodes move around, the overall shape of the grid tells a story.
Another overlooked strength of geo-grids is comparison. They allow you to evaluate multiple keywords, locations, or time periods side by side. That makes it easier to spot whether gains are isolated to one term or spreading across an entire service set—and whether improvements are happening where customers actually are.
Used this way, geo-grids act less like a report card and more like a radar. They don’t tell you everything, but they give you situational awareness. And in a system as dynamic as local search, that awareness is often the difference between reacting blindly and optimizing intentionally.
What Geo-Grids Are Not Designed to Do
For all their strengths, geo-grids have clear limitations—and most frustration around them comes from expecting answers they were never meant to provide. Geo-grids are visibility tools, not demand or revenue tools, and confusing those roles leads to bad conclusions.
Geo-grids do not measure how many people are searching for a keyword. A grid can look incredible for a term that gets almost no real-world demand. In that scenario, the visibility is real, but the business impact is minimal. The grid isn’t wrong—the strategy behind the keyword choice is.
They also don’t measure user behavior. Geo-grids can’t tell you whether someone clicked, called, requested directions, or booked an appointment. They don’t show friction in listings, poor conversion paths, weak reviews, or mismatched intent. All of that lives outside the grid.
Just as importantly, geo-grids don’t account for external factors like:
Seasonal demand shifts
Economic conditions
Competitive ad pressure
Changes in consumer behavior
Business capacity or service availability
This is why a geo-grid showing improved visibility doesn’t always result in immediate performance gains—and why a flat grid doesn’t automatically mean SEO work failed. Visibility is a prerequisite, not a guarantee.
The mistake isn’t using geo-grids. The mistake is using them alone. When geo-grids are treated as the sole measure of success, they become misleading. When they’re treated as one input among several—alongside search demand, analytics, and Google Business Profile performance—they become extremely informative.
Understanding what geo-grids don’t do is just as important as understanding what they do. It keeps expectations realistic and decisions grounded in how local search actually translates into business outcomes.
Visibility and Performance Are Not Competing Metrics
One of the more unhelpful narratives in Local SEO is the idea that you must choose between visibility metrics and performance metrics—as if focusing on one invalidates the other. In reality, they describe different parts of the same system.
Geo-grids measure where a business is eligible to be seen. Performance metrics measure what happens when people encounter that business. Those two things are connected, even if the connection isn’t always perfectly linear.
When keyword targeting is sound and demand is stable, improvements in visibility tend to show up downstream in Google Business Profile interactions. A meaningful increase in Share of Local Voice across relevant, high-intent terms usually correlates with increases in calls, clicks, direction requests, or messages over time. When that correlation exists, geo-grids help explain why performance improved.
When the correlation doesn’t exist, that’s not a reason to dismiss visibility data—it’s a reason to investigate. It may indicate:
The keywords gaining visibility don’t align with buyer intent
The listing isn’t compelling once it’s seen
Competition is absorbing demand through ads or stronger reviews
Seasonality is suppressing overall search volume
The business is visible, but not trusted
Performance metrics without visibility context can be just as misleading as visibility metrics without performance data. A spike in calls might look great until visibility starts declining and the pipeline dries up weeks later. A flat performance trend might look discouraging until you realize visibility is expanding during a low-demand season.
Geo-grids and performance data answer different questions, but they’re part of the same conversation. When viewed together, they explain not just what happened, but why it happened—and that’s where actionable strategy lives.
Seasonality and Market Reality Matter More Than Any Grid
Local search does not exist in a vacuum. Demand rises and falls based on weather, timing, budgets, urgency, and consumer behavior—factors that no geo-grid, no matter how sophisticated, can predict on its own. This is where many Local SEO strategies break down: visibility is measured without acknowledging whether people are actually looking.
Industries like pool services, HVAC, landscaping, roofing, and many residential services experience predictable seasonal swings. A pool company gaining visibility in December may not see a corresponding lift in calls—not because the SEO work failed, but because demand simply isn’t there. In those cases, geo-grids play a different role: they confirm that positioning is improving ahead of the next demand cycle.
This is where geo-grids are often misunderstood. They’re not always meant to explain current performance—they’re often validating future readiness.
Used properly during low-demand periods, geo-grids help answer questions like:
Are we maintaining visibility while competitors lose ground?
Are we expanding coverage before demand returns?
Are we positioned to capture traffic when seasonality shifts?
Conversely, during peak seasons, flat or declining performance can’t always be blamed on visibility alone. High ad density, aggressive competitors, staffing limitations, or reputation gaps can all suppress conversions even when geo-grid coverage looks strong.
Ignoring seasonality leads to bad conclusions in both directions. Rising visibility without immediate performance gains can look like failure. Falling performance during known demand slowdowns can trigger unnecessary changes. Geo-grids, when combined with seasonal awareness, help separate SEO effectiveness from market conditions.
Local SEO success isn’t about winning every week on a chart—it’s about being visible when customers are ready to act. Geo-grids help measure whether you’re earning that right.
Building a Balanced Local SEO Measurement Stack
The real problem in Local SEO isn’t that geo-grids exist—it’s that too many strategies rely on a single metric to explain a system that’s inherently multi-variable. Geo-grids are powerful, but they only make sense when they’re part of a broader measurement framework that reflects how visibility turns into real business outcomes.
A balanced Local SEO measurement stack typically includes four distinct layers, each answering a different question:
Geo-grids answer where a business is visible across its market
Google Business Profile performance answers how users interact once the business is shown
Analytics and conversion tracking answer what happens after the click or call
Search demand data answers whether enough people are actually searching
When these layers are evaluated together, patterns become much clearer. Visibility growth without interaction growth often points to intent mismatch or seasonality. Strong interaction growth without expanding visibility can signal short-term gains that may not be sustainable. Demand data explains why neither metric may move despite good execution.
This layered approach also prevents overreacting to any single data point. A temporary dip in geo-grid coverage doesn’t automatically mean rankings are collapsing. A slow month in GBP calls doesn’t mean visibility is gone. Each metric acts as a check on the others.
The goal isn’t to find the “best” metric—it’s to understand how each one contributes to the full picture. Geo-grids provide spatial awareness. Performance metrics provide behavioral confirmation. Demand data provides context. Together, they create a system that’s far more resilient than any individual report.
When Local SEO measurement is built this way, conversations shift away from “where do we rank?” and toward “are we positioned to capture demand, and are we converting it when it shows up?” That’s the difference between reporting activity and managing growth.
Geo-Grids as One Instrument, Not the Entire Dashboard
Geo-grids are neither broken nor magical. They don’t deserve blind faith, and they don’t deserve to be dismissed because they fail an impossible standard of perfection. They are one instrument in a much larger system—useful when read correctly, misleading when treated as a verdict.
Local search is probabilistic, contextual, and constantly shifting. Any tool that attempts to observe it will reflect that reality. Geo-grids embrace this by modeling visibility across space rather than pretending a single rank exists. Their value lies in trends, patterns, and movement—not in frozen snapshots.
The real failure in Local SEO measurement isn’t imperfect data. It’s treating any single metric as if it tells the whole story. A bright green grid with no demand won’t generate revenue. Strong performance without expanding visibility often isn’t sustainable. Ignoring either side leads to short-term thinking and poor strategy.
When geo-grids are used alongside Google Business Profile performance, analytics, and demand context, they become what they were always meant to be: a practical way to understand where visibility exists, where it’s missing, and how that reality changes over time. Not a scorecard. Not a promise. A diagnostic tool.
Local SEO works best when measurement reflects how Google actually operates—not how we wish it did. Geo-grids fit into that reality when they’re treated as one part of a thoughtful, multi-layered approach to growth.
COMPANY
RESOURCES
LEGAL
© Copyright 2026. High Level Consulting.
All Rights Reserved.
High Level Consulting is not affiliated with, endorsed by, or associated with Facebook in any way. FACEBOOK is a trademark of FACEBOOK, Inc.